Average Height and Weight for Babies and Toddlers

There's a moment most new parents know well. The pediatrician pulls out the growth chart, starts plotting dots, and suddenly you're staring at a graph trying to figure out what "75th percentile" actually means for your child. This guide breaks down what typical growth looks like from birth through age 3, what the numbers actually mean, and when it's worth bringing a concern to your pediatrician.
Key Takeaways
- Babies roughly triple their birth weight by age 1 and nearly double their birth length by age 2 — the fastest growth window of a person's life.
- A percentile ranking isn't a grade. It only shows how your child compares to same-age, same-sex peers — not whether they're "ahead" or "behind."
- What pediatricians watch most closely is the shape of your child's own curve, not the specific number on it.
- Boys tend to be slightly heavier and longer than girls from birth through toddlerhood — which is why separate WHO/CDC charts exist for each sex.
- A sudden drop or spike across percentile lines is worth a pediatrician conversation; steady tracking along any line generally is not.
Why Growth Tracking Matters in the Early Years
The first three years of life are the most rapid growth period a human being will ever experience. A baby roughly triples their birth weight by their first birthday and nearly doubles their birth length by age two. Nothing that happens later in life even comes close to this rate of physical development.
Tracking growth during this window matters for a few important reasons:
- It's one of the earliest indicators of overall health. Consistent, steady growth generally signals that a child is getting adequate nutrition and developing normally. Sudden drops or plateaus can be early flags worth investigating.
- It helps catch nutritional gaps early. Underweight or underheight trends in infancy and toddlerhood can reflect feeding difficulties, digestive issues, or nutrient deficiencies that are far easier to address when caught early.
- It establishes a personalized baseline. Growth charts aren't just about comparing your child to others — they're about tracking your child's individual curve over time. A consistent pattern at the 20th percentile is completely normal. A sudden drop from the 60th to the 20th percentile in a short window is worth a conversation with your doctor.
Average Height & Weight by Age (0–5 Years)
Hover (or tap and hold, on touch devices) any bar for the exact height and weight — or check the table below.
| Age | Boys — Height | Boys — Weight | Girls — Height | Girls — Weight |
|---|---|---|---|---|
| 0 yr | 1'8" (50 cm) | 7.7 lb (3.5 kg) | 1'7" (49 cm) | 7.3 lb (3.3 kg) |
| 1 yr | 2'6" (75 cm) | 20.9 lb (9.5 kg) | 2'5" (74 cm) | 19.8 lb (9.0 kg) |
| 2 yr | 2'10" (87 cm) | 26.9 lb (12.2 kg) | 2'9" (85 cm) | 25.4 lb (11.5 kg) |
| 3 yr | 3'2" (96 cm) | 31.5 lb (14.3 kg) | 3'1" (95 cm) | 30.6 lb (13.9 kg) |
| 4 yr | 3'5" (103 cm) | 35.9 lb (16.3 kg) | 3'4" (102 cm) | 34.8 lb (15.8 kg) |
| 5 yr | 3'7" (110 cm) | 40.3 lb (18.3 kg) | 3'7" (109 cm) | 38.6 lb (17.5 kg) |
Values shown are median (50th percentile) figures, simplified for visualization and educational purposes. You can plot your own child's numbers precisely using our Growth Chart Tracker or Growth Percentile Calculator.
⚠️ This content is for informational purposes only and should not be used as a substitute for professional medical advice. Always consult a qualified healthcare provider for growth concerns.
▶ Watch: Average Height and Weight for Babies & Toddlers (Growth Chart)
Watch on YouTube ↗Understanding Growth Percentiles
This is where a lot of parents get tripped up.
A percentile ranking does not mean your child is ahead or behind. It simply means how your child compares to a reference population of the same age and sex.
A baby at the 50th percentile for weight is right at the middle — heavier than 50% of babies their age, lighter than the other 50%. A baby at the 10th percentile isn't underweight. It means they're smaller than 90% of babies their age — which, for a child who has consistently tracked at the 10th percentile since birth, is completely normal for them.
What pediatricians pay the most attention to is the shape of the curve, not the number itself. A child who tracks steadily along their own percentile line — whether that's the 5th or the 95th — is generally considered to be growing well. The concern arises when a child's growth curve suddenly shifts significantly, either dropping or spiking, relative to their own established pattern. Curious where your child's own numbers land? Our Height-for-Age Z-Score Calculator can help translate a single measurement into that context.
Month-by-Month Growth: What to Expect
Birth to 3 Months
The fastest growth window of the entire first year. Most newborns lose 5–7% of their birth weight in the first few days, then regain it by day 10–14. From there, average gain is roughly 1–1.5 oz per day, with length increasing about 1–1.5 inches per month.
3 to 6 Months
Growth stays rapid but slows slightly from that initial burst. Weight gain typically averages around 1–1.25 oz per day. By 4 months, most babies have doubled their birth weight — a classic milestone pediatricians look for.
6 to 12 Months
The pace slows further: roughly 3–5 oz per week, and length increases about half an inch per month. This is also when solid foods typically enter the picture, which can influence growth as the digestive system adjusts.
12 to 24 Months
A noticeable slowdown as infancy shifts to toddlerhood. Appetite often drops around age 1 — completely normal, since growth rate (and calorie need) is slowing. Toddlers gain roughly 5 lbs and grow about 4–5 inches over the year.
24 to 36 Months
By age 2, most toddlers settle into a predictable pattern: roughly 4–5 lbs and 2.5–3.5 inches over the year. This steadier pace continues through early childhood until the next major growth acceleration — puberty.
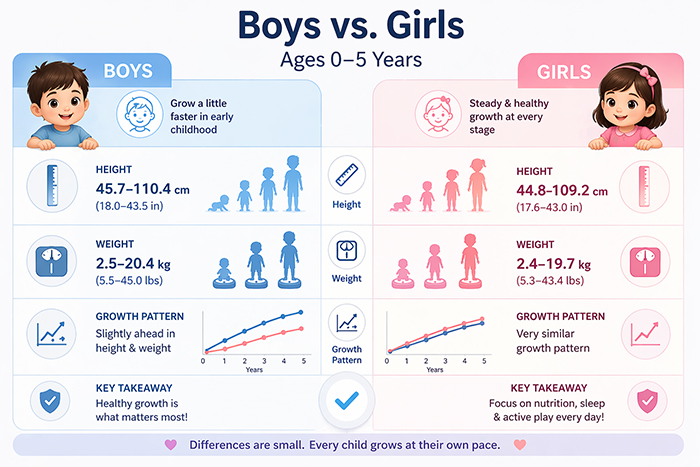
Boys vs. Girls: Are There Differences?
Yes — though they're relatively modest in the first two years. At birth, boys tend to be slightly heavier and longer than girls on average, and this gap remains fairly consistent through toddlerhood. The CDC and World Health Organization (WHO) maintain separate growth charts for boys and girls for this reason — using the wrong chart for your child's sex would give you inaccurate percentile readings.
The more significant divergence happens later, around puberty, when the timing and intensity of growth spurts differ considerably between sexes. For babies and toddlers, the difference is real but not dramatic.
▶ Watch: Can Short Parents Have A Tall Child?
Watch on YouTube ↗When Should You Be Concerned?
Most growth variations in early childhood are completely normal. But there are a few patterns worth flagging to your pediatrician:
Dropping significantly across percentile lines. If your child drops from the 60th percentile to the 20th over a short period — not gradually over years, but relatively quickly — that's worth discussing.
Consistently below the 3rd percentile. This doesn't automatically signal a problem, but it warrants closer monitoring and possible evaluation.
No weight gain over a 2–3 month period in infancy. In the first year especially, consistent forward progress matters.
A significant gap between height and weight percentiles. A toddler at the 70th percentile for height but the 10th for weight may warrant a closer look at nutritional intake or underlying issues.
That said — pediatricians exist for exactly this kind of monitoring. Growth chart conversations are a routine part of well-child visits for a reason. You don't need to become an expert in percentile analysis. You just need to show up to those appointments consistently.
Tips for Supporting Healthy Growth in the Early Years
You don't need to do anything complicated. The basics, done consistently, cover most of it:
- Prioritize responsive feeding. Whether breastfeeding, formula feeding, or a combination, feeding on demand in the early months supports both growth and healthy appetite regulation.
- Introduce solids at the right time. The American Academy of Pediatrics recommends starting solid foods around 6 months. Early introduction isn't associated with faster growth and can cause digestive issues.
- Don't stress the appetite fluctuations. Toddlers are notoriously inconsistent eaters. A day of barely eating followed by a day of eating everything in sight is completely normal — their bodies are self-regulating.
- Keep well-child visits. These appointments exist to catch exactly the kind of gradual changes that are hard to notice day-to-day. Don't skip them, even when your child seems perfectly healthy.
- Watch sleep. Growth hormone is primarily released during deep sleep — even in infancy. See How Sleep Affects Height Growth for more on why protecting sleep quality and duration matters from the very beginning.
Bottom Line
Growth charts can feel intimidating, but they're really just a tool — a way of visualizing your child's development over time in the context of broader population data. The number that matters most isn't the percentile. It's the consistency of your child's own curve.
A baby who tracks steadily at the 15th percentile from birth through toddlerhood is growing exactly as they should. A toddler who suddenly drops off their established curve is worth a conversation with a doctor — not a reason to panic, but a signal worth paying attention to.
Trust the process, keep the appointments, and remember: children have been growing without parental intervention for a very long time. Your job isn't to engineer the outcome. It's to provide the conditions — good nutrition, enough sleep, plenty of love — and let the biology do what it's designed to do. If you'd like a quick way to check where your own child lands, our Height and Weight Calculator by Age is a good place to start.
❓ Frequently Asked Questions
What is the average weight of a newborn baby?
Most full-term newborns weigh between 5.5 and 8.8 pounds (2.5–4 kg). Anything within that range is generally considered healthy — your pediatrician will flag anything outside it at birth.
My baby lost weight right after birth. Is that normal?
Completely normal. Most newborns lose 5–7% of their birth weight in the first few days as the body adjusts. By day 10–14, they're typically back to birth weight and gaining steadily.
When do babies typically double their birth weight?
Most babies double their birth weight by around 4 months and triple it by their first birthday. These are classic milestones pediatricians look for during well-child visits.
How often should I track my baby's height and weight?
Your pediatrician handles this at every well-child visit — typically at 1, 2, 4, 6, 9, 12, 15, 18, and 24 months, then annually after that. You don't need to measure at home obsessively. Just keep those appointments.
What does it mean if my toddler is in the 20th percentile?
It means they're smaller than 80% of kids their age — and that's perfectly fine if they've been consistently tracking there. Percentiles aren't grades. What matters is that your child follows their own curve over time.
My toddler barely eats some days. Should I be worried?
Probably not. Appetite fluctuations in toddlers are completely normal — their growth rate is slowing down, so their calorie needs are lower relative to their size. As long as their growth curve stays consistent, erratic eating days are just part of the toddler experience.
📚 References
- World Health Organization. (n.d.). WHO child growth standards (0–5 years). https://www.who.int/tools/child-growth-standards
- Centers for Disease Control and Prevention. (n.d.). CDC growth charts (2–20 years). https://www.cdc.gov/growthcharts/
- American Academy of Pediatrics. (2023). Starting solid foods. https://www.healthychildren.org/English/ages-stages/baby/feeding-nutrition/Pages/Starting-Solid-Foods.aspx
- Ogden, C. L., et al. (2015). Mean body weight, height, waist circumference, and body mass index among adults. National Health Statistics Reports, 86. https://www.cdc.gov/nchs/data/nhsr/nhsr086.pdf